2026 Best Solar Cost Guide for Global Buyers?

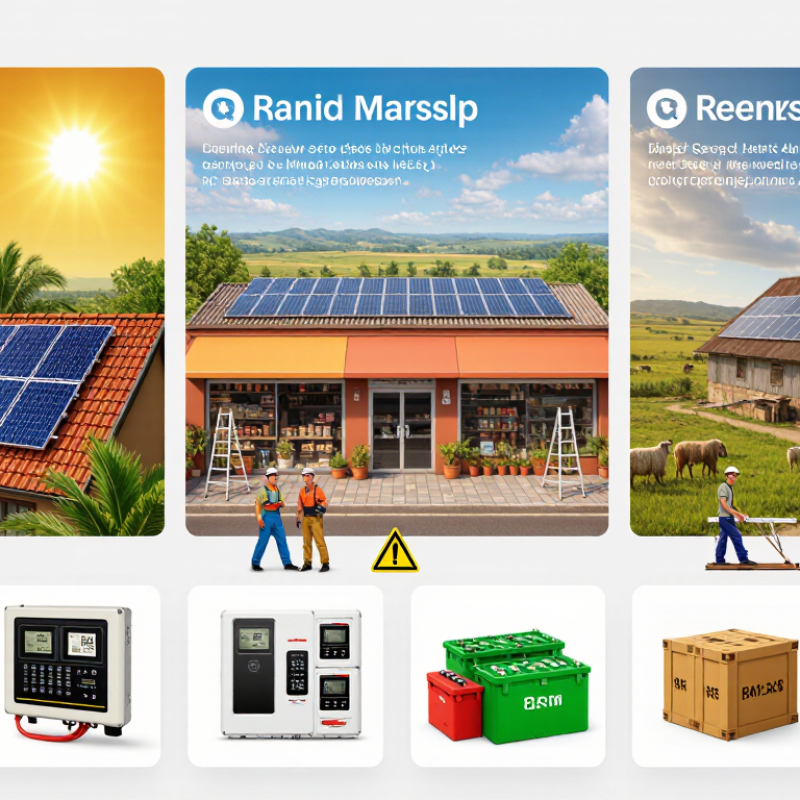
In 2026, solar buying decisions will depend on more than panel prices. A household in Nairobi, a retailer in Madrid, and a farm in Queensland face different sunlight, financing, and installation realities. This guide explains solar cost through those local differences, not through a single global average.

We examine module efficiency, inverter quality, batteries, labor, shipping, permits, taxes, and maintenance. A 5-kilowatt rooftop system may look affordable online, yet mounting hardware can change the final quote. Currency movements can also reshape a project within weeks. Buyers should request itemized proposals, warranty terms, production estimates, and expected payback periods. Independent certifications and installer experience matter. So does the roof. A shaded roof may produce less than a smaller, unshaded design.

Reliable comparisons require evidence. We will consider market data, manufacturer specifications, installer practices, and regional energy conditions where available. However, cost estimates are not promises. Prices vary by country and sometimes by neighborhood. Battery replacement, grid rules, insurance, and financing fees are often overlooked. That is where attractive calculations become unreliable.

Some assumptions need challenging. The cheapest quote is rarely the safest long-term choice. The largest battery is not always the best investment. Readers should test every estimate against electricity bills, roof measurements, weather patterns, and future energy use. This guide supports informed decisions, while recognizing that solar cost can never be perfectly universal.
2026 Best Solar Cost Guide for Global Buyers?

Solar Cost Fundamentals and Key Price Drivers in 2026

Solar Cost Fundamentals and Key Price Drivers in 2026

Solar costs in 2026 depend on more than panel prices. A buyer must price equipment, labor, permits, grid work, financing, and maintenance together. IRENA reported a global utility-scale solar LCOE of about USD 0.044 per kilowatt-hour in 2023. That figure was nearly 90% lower than in 2010, but local projects can differ sharply. Site conditions matter.

Module prices fell substantially during 2023, according to the IEA Photovoltaic Power Systems Programme’s Trends in Photovoltaic Applications 2024. Yet cheaper modules do not automatically create cheaper electricity. In a rooftop quote, cables, mounting rails, scaffolding, and protection devices can quietly add thousands of dollars. Inverters may also need replacement before the panels reach their full operating life. Batteries increase resilience, but they raise the initial budget considerably.

Financing is often the hidden price driver. A high interest rate can outweigh a modest equipment discount. Import duties, currency movements, freight costs, and local labor shortages can change a quotation within weeks. Buyers should request an itemized offer, expected annual generation, degradation assumptions, warranty terms, and grid-connection costs. These figures are not promises. Real projects remain messier than international averages, and some forecasts still underestimate delays. A careful buyer should test optimistic and conservative scenarios before approving the contract.

Global Solar System Cost Breakdown by Technology and Scale

In 2026, global solar system costs vary more by scale, technology, and local labor than by panel price alone. A small residential crystalline-silicon system may cost about US$900–1,800 per kilowatt before incentives. Installation, permits, transport, and roof repairs can shift the final figure sharply. Cash flow matters.

Commercial rooftop projects often reach US$650–1,300 per kilowatt because engineering and equipment are spread across larger capacity. Utility-scale solar can fall near US$500–1,000 per kilowatt, excluding major grid upgrades and land development. Thin-film technology may suit large, hot sites, but its lower material cost does not always produce the lowest installed cost. Site conditions decide.

Battery storage changes the calculation. A lithium-based storage system may add roughly US$300–800 per usable kilowatt-hour, depending on duration, safety equipment, and local integration work. Off-grid systems cost more because they need extra storage, backup generation, and system controls. A 5-kilowatt home system with a 10-kilowatt-hour battery might exceed US$15,000 in many markets. That estimate is imperfect. Exchange rates, import duties, roof structure, and installer quality can move it by thousands. Buyers should request itemized quotations, verify production assumptions, and compare warranties with independent technical advice.

2026 Best Solar Cost Guide for Global Buyers? — Global Solar System Cost Breakdown by Technology and Scale

Indicative 2026 global-market ranges in U.S. dollars. Costs are planning estimates rather than supplier quotations and may vary by country, exchange rate, labor, logistics, taxes, grid requirements, and permitting conditions.
System Segment Typical System Size Primary Technology Typical Turnkey Cost Approx. Cost per Watt Estimated Annual Energy Yield Storage Configuration Expected Service Life Main Cost Drivers
Small Residential Rooftop 3–6 kW Monocrystalline silicon PV, grid-connected $4,500–$15,000 $1.50–$2.50/W 3,600–9,600 kWh/year No battery or optional 5–10 kWh battery 25–30 years for PV modules Roof complexity, labor, local permitting, electrical upgrades, and retail installation margins
Large Residential Rooftop 7–15 kW High-efficiency monocrystalline PV, grid-connected $8,400–$33,000 $1.20–$2.20/W 8,400–24,000 kWh/year Optional 10–20 kWh lithium iron phosphate battery 25–30 years for PV modules; 10–15 years for battery Roof structure, backup requirements, inverter capacity, and local labor rates
Commercial Rooftop 50–500 kW Monocrystalline PV, three-phase grid connection $40,000–$750,000 $0.80–$1.50/W 65,000–800,000 kWh/year Usually no battery; optional 100–1,000 kWh battery 25–30 years for PV modules Roof loading, fire-code compliance, interconnection, access equipment, and engineering
Commercial or Industrial Ground-Mount 0.5–5 MW Monocrystalline PV with fixed-tilt mounting $325,000–$6,000,000 $0.65–$1.20/W 700,000–8,500,000 kWh/year Optional 1–10 MWh battery 25–35 years for PV modules and structures Site preparation, fencing, medium-voltage equipment, land conditions, and grid interconnection
Utility-Scale Fixed-Tilt Solar Farm 10–100 MW Large-format monocrystalline PV with fixed-tilt structures $5,000,000–$90,000,000 $0.50–$0.90/W 15,000,000–190,000,000 kWh/year Optional 10–200 MWh battery 30–35 years for PV modules and balance of system Module and inverter procurement, transmission connection, civil works, land, and financing
Utility-Scale Single-Axis Tracker 50–500 MW Monocrystalline PV with single-axis tracking $0.60–$1.05/W $0.60–$1.05/W 90,000,000–1,000,000,000 kWh/year Optional 50–1,000 MWh battery 25–35 years for PV modules; 20–30 years for tracking structures Tracker foundations, terrain, wind conditions, operations and maintenance, and transmission infrastructure
Solar-Plus-Storage Microgrid 100 kW–5 MW PV plus 0.5–20 MWh storage PV, lithium iron phosphate battery, energy-management system, and microgrid controls $1.20–$2.80/W of PV capacity, excluding unusual civil works $1.20–$2.80/W of PV capacity 130,000–8,500,000 kWh/year from PV 4–8 hours of battery duration is common 25–30 years for PV; 10–15 years for battery system Battery duration, backup power requirements, controls, genset integration, and remote-site logistics
Off-Grid Rural or Remote System 5–100 kW PV plus 20–500 kWh storage PV, battery storage, inverter, distribution equipment, and optional backup generator $2,000–$5,500/kW of PV capacity $2.00–$5.50/W of PV capacity 6,500–170,000 kWh/year from PV 1–3 days of usable energy storage 20–30 years for PV; 8–15 years for battery Transportation, installation access, battery sizing, distribution networks, and maintenance availability
Solar Water-Pumping System 2–100 kW PV PV array, variable-speed pump controller, submersible or surface pump, and water storage $5,000–$350,000 per project $2.50–$5.00/W of PV capacity 2,600–170,000 kWh/year equivalent energy input Usually water storage instead of electrical batteries 15–25 years for PV; 5–15 years for pumps and controllers Well depth, pumping head, pipe length, water-storage capacity, and remote installation conditions
Cost interpretation: The ranges generally include PV modules, inverters, mounting structures, standard electrical equipment, installation, and basic commissioning. They generally exclude land purchase, major transmission upgrades, unusual foundations, import duties, sales taxes, financing costs, permitting delays, and extensive site remediation. Annual energy estimates assume a typical global solar resource of approximately 1,200–2,000 equivalent full-load hours per year; actual production depends on location, orientation, shading, temperature, system losses, and availability.

Regional Solar Prices, Incentives, and Market Differences

Regional solar pricing is shaped by equipment, labor, financing, and grid access. The International Renewable Energy Agency reported a global weighted-average utility-scale solar cost of about US$758 per kilowatt in 2023. Its electricity cost reached roughly US$0.044 per kilowatt-hour. Prices are not equal everywhere. China and India often benefit from lower manufacturing and installation costs. Europe may face higher labor expenses but stronger public incentives. In some emerging markets, imported equipment and weak grids increase final project costs.

Incentives also change the buying decision. Auctions can reduce utility-scale prices through competitive bidding. Tax credits, rebates, and net-metering policies can improve residential returns. The International Energy Agency expects solar power to remain the largest source of new renewable capacity through 2030. However, policy delays can damage project economics. A cheap panel does not guarantee a cheap system. Permits, storage, insurance, and local taxes may quietly add thousands of dollars.

Tips: Compare complete system prices, not panel prices alone. Request at least three regional quotations. Check warranty terms, installer experience, battery assumptions, and grid-connection fees. Ask for production estimates using local sunlight data. I would also test the financial model with lower output and higher interest rates. Global averages are useful, but they can mislead. A coastal project, a desert project, and a cloudy urban roof need different assumptions. Data from the IRENA Renewable Power Generation Costs report and the IEA Renewables 2024 report provides a stronger starting point than online price lists.

How to Calculate Total Solar Ownership Costs

Solar ownership costs begin with more than the equipment price. Build a line-item budget before comparing offers. Include panels, inverters, mounting hardware, wiring, delivery, installation, permits, inspections, and grid-connection fees. Battery storage can change the calculation significantly. Financing adds interest, origination fees, and sometimes insurance requirements. Ask for an itemized quotation, not a single attractive number.

My first solar spreadsheet missed roof repairs and temporary scaffolding. That mistake mattered. Check the roof condition, local labor rates, property taxes, and currency movements. Annual costs may include monitoring, cleaning, insurance, and inverter servicing. Solar panels gradually lose output, so include a realistic degradation allowance. Battery systems may also need replacement earlier than the panels. Obtain current incentive details from government agencies and utility authorities. Rules differ widely between countries and even neighboring regions.

Use this simple lifetime estimate: total ownership cost equals purchase and installation costs, plus financing, maintenance, replacements, and insurance, minus verified incentives and energy savings. Divide that result by expected lifetime electricity production to estimate the cost per kilowatt-hour. Then compare it with your likely utility rate, not today’s promotional rate. Request production estimates based on local weather data and shading measurements. Independent review helps. Estimates can still be wrong. Snow, dust, outages, or changing electricity prices may affect the result. A qualified local professional should verify structural, electrical, and regulatory assumptions before payment.

Buyer Checklist for Comparing Global Solar Suppliers

For global solar buyers, supplier comparison should begin with evidence, not the lowest quotation. Request a complete technical sheet for modules, inverters, batteries, and mounting systems. Check power tolerance, temperature performance, degradation rates, and tested safety standards. Ask whether an independent laboratory verified these figures. Marketing language is not enough.

Calculate the landed cost, including freight, insurance, customs duties, installation, spare parts, and local taxes. Confirm the quotation currency and payment milestones. Review production capacity, lead times, packaging photographs, and batch traceability. A reliable supplier should explain where components are made and how quality is inspected. Request recent inspection records, warranty terms, and service response times. Speak with buyers operating in a similar climate.

Do not ignore local grid rules or certification requirements. Documents may appear complete but still lack approval for your market. Check company registration, export history, financial stability, and contract responsibilities. Clarify who pays when defective units arrive. Get sample testing before placing a large order. Small details matter.

The cheapest offer can become expensive after delays or replacements. A spreadsheet helps, but it cannot measure communication quality. Procurement teams sometimes overvalue factory size and undervalue after-sales support. That judgment deserves review. One overlooked clause may affect an entire project. Better comparisons use verified documents, realistic operating conditions, and questions that suppliers can answer clearly.